When I first started brainstorming the original player cards for LB-Hockey back in 2021, there were multiple skills that I wanted to include due to their importance in player evaluation and lack of representation in the public sphere. Most of these were passing or situation-related in tandem with some expected goal calculation to quantify them.
What is (not) out there?
I then came to realize that there was a reason why these were not very prominent throughout the available visualizations and dashboards. Delving into MoneyPuck’s shot data (moneypuck.com), the problem is made clear. Although the NHL provides various parameters for each shot attempt, passes leading to them are not registered anywhere (except on goals which are an extremely small percentage of the dataset).

(Editor’s Note: MoneyPuck data has since been replaced with our own NHL-API data pipeline and expected goal/value models as of March 2026)
As you can imagine, this can be kind of an issue when you are hoping to measure a skater’s playmaking ability through the use of expected assists (or xA). Now it does not mean that this type of passing tracking is entirely unavailable. Corey Sznajder tracks hundreds of games every season as part of his incredibly insightful All-Three-Zones project (allthreezones.com) which provides a wealth of useful data. Lots of it is integrated into the tools at LB-Hockey and allows for the depth of metrics and analysis hosted here. I highly recommend checking out and supporting his work if you can. The portion that is relevant in this case is the detailed game logs he makes available to subscribers.

On top of your usual shot time, type, outcome, strength of play, and shooter, Sznajder tracks stuff like which situation led to the shot (cycle, forecheck, rush), zone of origin for the play, goalie screen, scoring chance, and even more added context. Most notable of all is the presence of the three most recent passes leading to the shot (as well as their originating zone).
So in one corner, we have the detailed shot context we have been looking for thanks to AllThreeZones (A3Z) for a sizeable number of games. And in the other, we have tons of positional and time indicators with MoneyPuck’s (MP) complete shot database and expected goal model. Everything we need in terms of raw data is pretty much there and available to the public. Seems like all that is needed now, is a bridge.
Bridging the Data Gap
The NHL assigns a unique shotID number for each shot attempt. While this identifier is not present in Corey Sznajder’s shot tracking sheets, the MP and A3Z datasets share a number of features that allow for a potential merging process. The shot period, game time, team, type (backhand, slap, wrist, tip, etc.), outcome (miss, on net, goal), and shooter-goalie pair are noted in both sources. This should be enough for the large majority of shot attempts to be matched with their equivalents on the other side of the data pond.

Nonetheless, there are still multiple data incompatibilities that need to be worked out. Some examples are the A3Z sheets using player number identifiers that are linked to roster lists, ensuring game identifiers (gameIDs) are marked properly for NHL API calls to merge in playerIDs in those roster lists, and shot time following different recording conventions.
With all this ironed out, we can move on to actually matching shot instances. The algorithm in charge of this relies on various filters and conditions to restrict possible options and whittle them down to find the optimal MoneyPuck match for each shot in every tracked AllThreeZones game. As can be seen in the picture above, this relies on finding shots that are recorded within a close amount of time, and share certain features such as shot type, outcome, and shooter. All the while, proper handling of duplicate matches needs to be accounted for on top of potential mis-inputs during manual tracking (ex: shooter number being off by a keystroke).
Reaping What We’ve Sown
After some more final quality assurance, the process is complete. In terms of script efficiency, the procedure is capable of finding matches for roughly 90% of the tracked A3Z shots, resulting in a database averaging 25-35k shot attempts based on the final products of the last three years. Previously, a season sample of 400 games would take 10 or more minutes to digest. But following some much-needed re-factoring, a switch to a more modern machine, and the implementation of parallel programming, it has been reduced significantly to a sub-30-second endeavour.
The result is a database that links expected goal values to in-depth contextual indicators. Various columns indicate whether a shot was taken off the rush, forecheck, or cycle, or even if the play was a one-timer, through a screen, or crossed the royal road (imaginary centre line splitting the ice in two). Better still, we now have that manually tracked passing data, all the way to the tertiary assist level (if existent), connected to expected goal values for all linked shot attempts.

Putting all this together, we have the option to calculate metrics that were not previously computable with publicly available data such as expected primary assists (xA1) off the rush, xG on cycle plays, or Goals Saved Above Expected (GSAx) on screened shots. And these are the types of statistics that are used all throughout the LB-Hockey suite.
Looking at the multi-year skater cards for example, the Playmaking skill uses a weighted xA calculation, Transition Offence is a player’s expected primary points on rush plays, and Individual Creation takes into account zone and assist context to estimate the value a player creates when generating chances for themselves. On the goalie side, the Rush and Cycle metrics evidently make use of our new product, while the Play Anticipation stat evaluates performance on shots resulting from certain passing plays, and Vision looks at shots that are taken from distance through screens and traffic.
The metric that most harnesses the potential of this linked shot database, is the Importance to Teammate Offence skill.
Network Analysis Modelling in Hockey
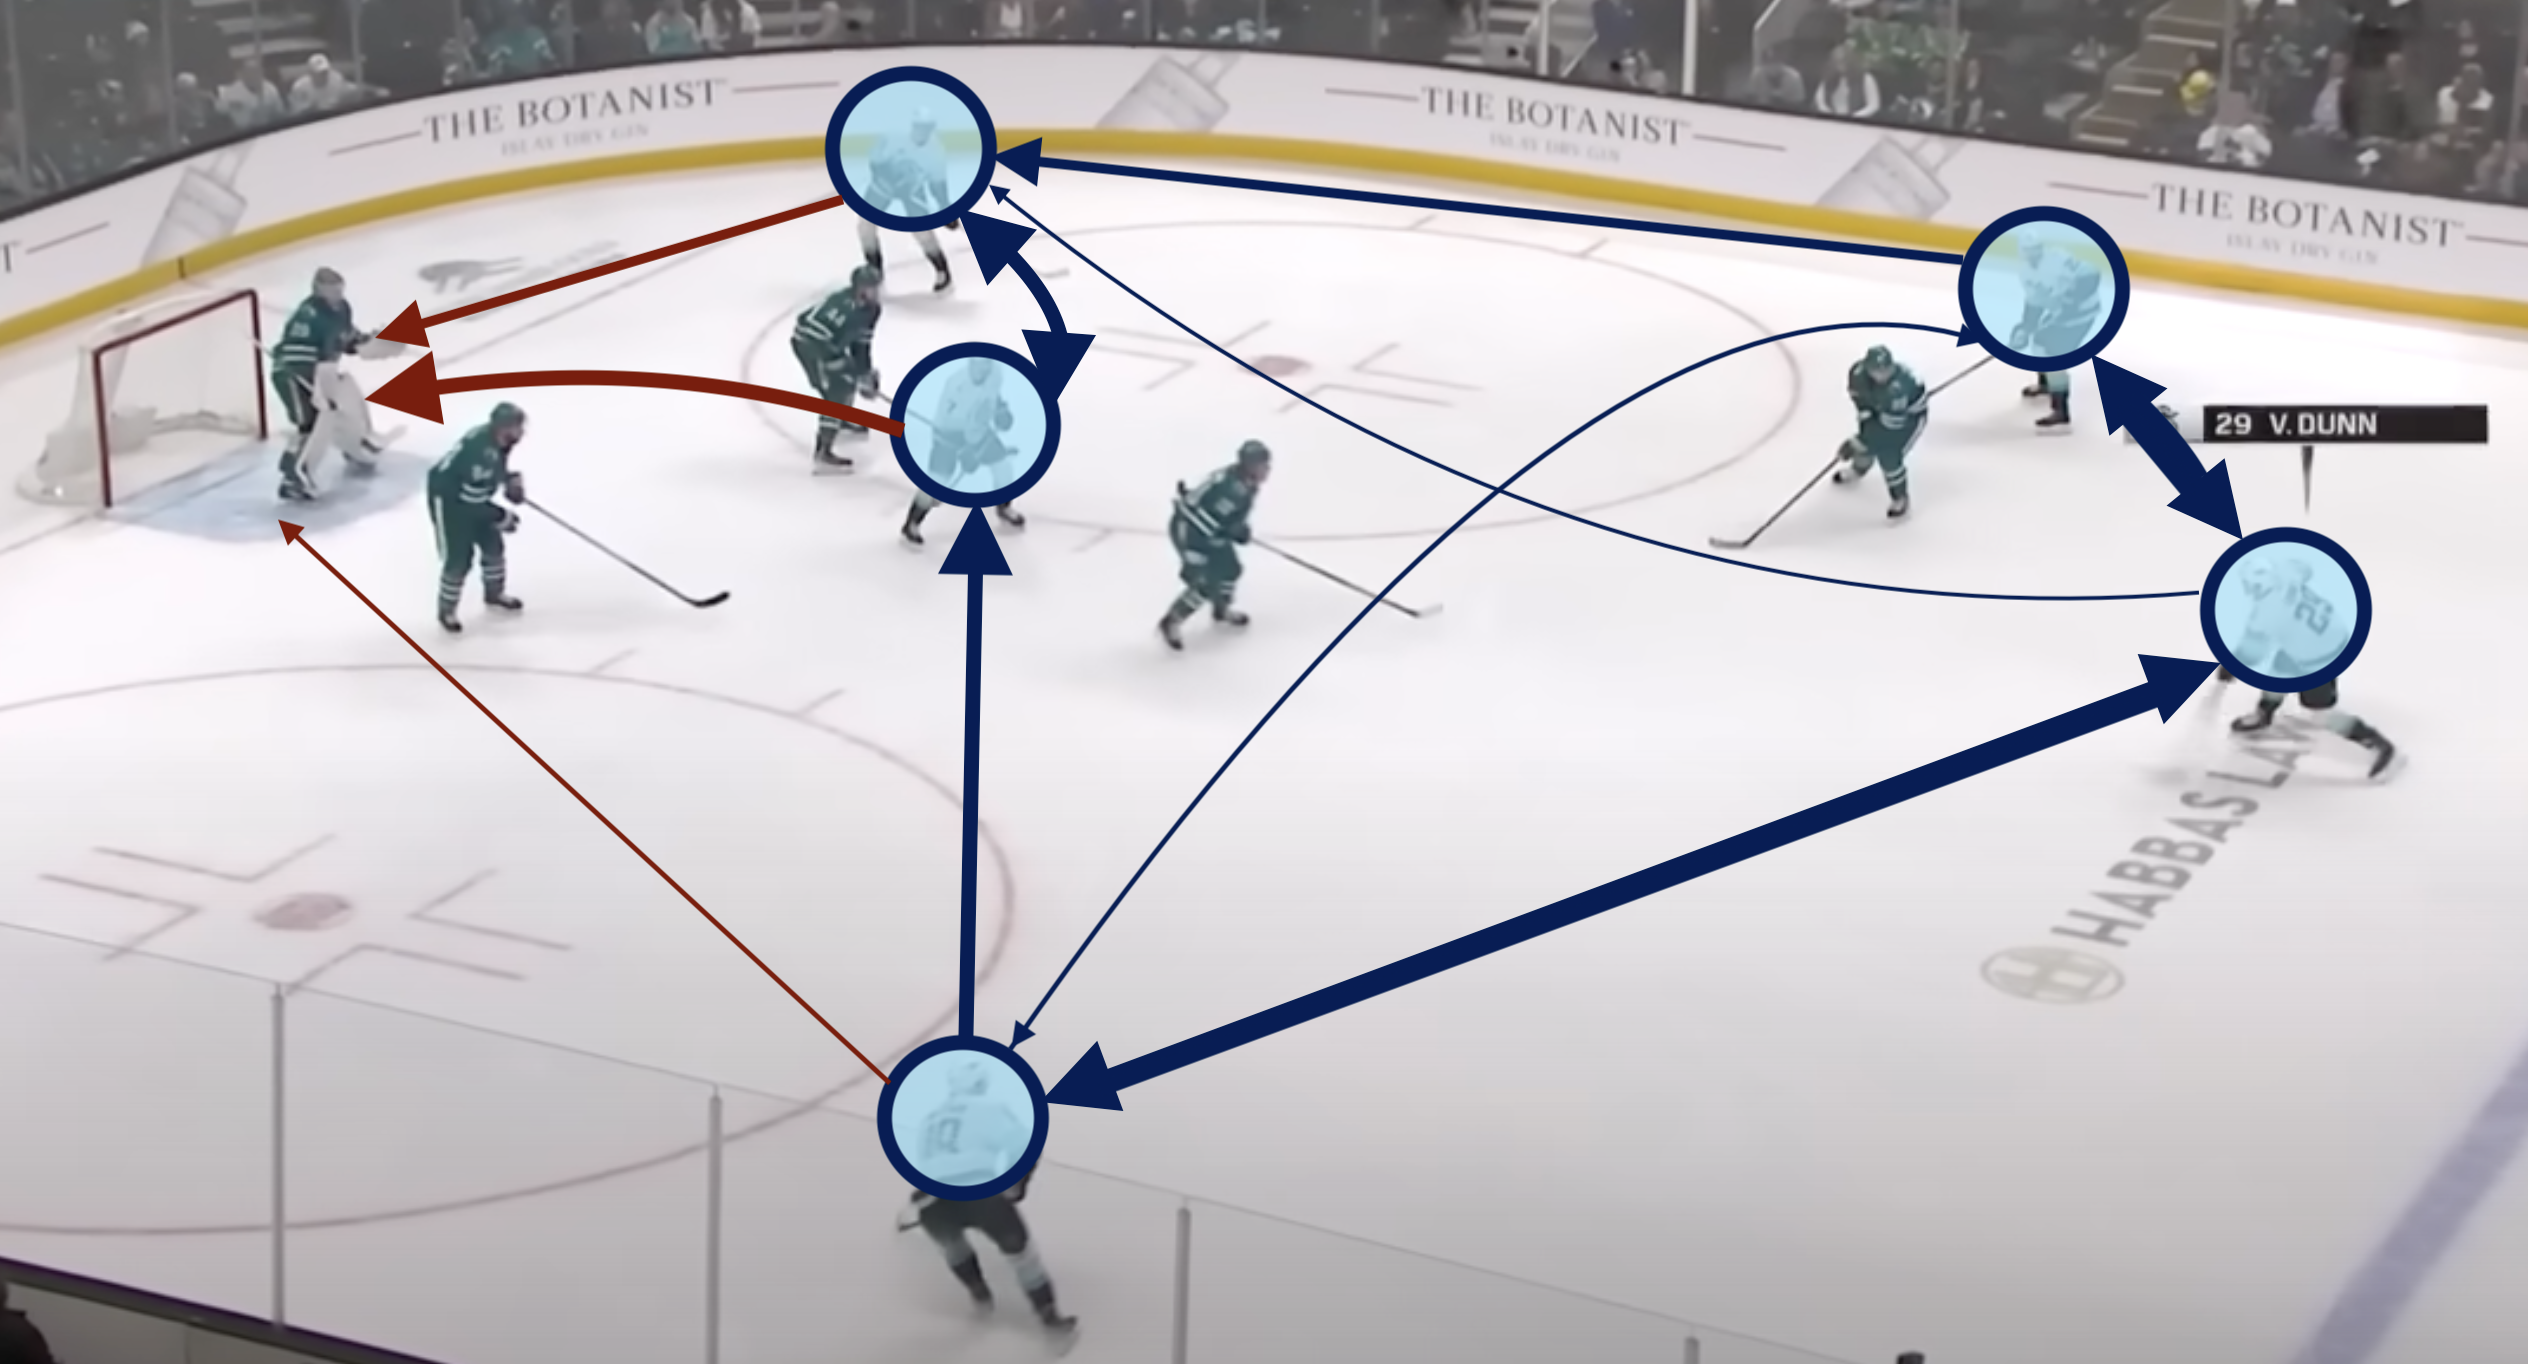
Network analysis has always been a favourite of mine throughout my studies in data science and machine learning. As a quick explainer, this concerns the evaluation of relationships within a structure made of nodes that are connected through edges. Analyzing a passing network within a team instantly felt like a natural way to implement this into my work, with the players acting as the nodes, and the passes between them as the edges. However, the data necessary to do so was simply not available until the creation of this specific database.
To make this work, we first need to separate all recorded shot assists into individual passing instances. This means identifying the source and receiver for every tertiary, secondary, and primary assist leading to a shot attempt. So for example P3-to-P2 for the A3, P2-to-P1 for the A2, and lastly P1-to-SH for the A1.
It is also important to acknowledge that not all passes are created equal: minor-impact passes should not be treated the same as those leading directly to a shot. The same can be said for passes that may share assist levels (ex: both primary) but set up a far better or worse chance than the other. Thus, two variables are used to assign a value to each pass/edge: shot separation and pass threat.
The latter looks to estimate pass value by taking the expected goal of the shot resulting from the passing play. In contrast, the first variable simply assigns a number depending on how distant the pass in question was from a shot. Most people with exposure to hockey statistics have seen the argument for the lower value of secondary assists relative to their primary counterparts, as they are less repeatable and generally have a less direct impact on goals. This can be extended to an even more drastic fall-off when evaluating tertiary assists.
With this in mind, we will use their weights in the fairly common “Game Score” metric which, from what I can find, first surfaced in this article from Hockey-Graphs. In these calculations, goals, primary assists, and secondaries are valued at 0.75, 0.70, and 0.55 respectively. Since tertiary assists are not recorded on goals, they do not appear here, so I have had to extend the pattern of diminishing importance. Since the decrease from G to A1 is 0.05, then A1 to A2 is 0.15, we can prolong the trend by continuing to add 0.10 to this difference. This gives us a drop of 0.25 (0.15+0.10) from the A2’s value, meaning our A3 estimate lies at 0.30 (0.55-0.25).
To finalize the weights of our connections, all that is left to do is multiply these two variables, shot separation and pass threat, by one another. For every game, each team’s network graph can be built using our now-completed framework as we have defined our nodes, edges, directions, and weights.

Quantifying Importance with Centrality Measures
Although all the data has been set in place, we still need to define how we are measuring importance here. Lots of work has been done in this field of analysis to draw insights from these types of networks. And as is the case throughout data science, there is no end-all-be-all answer in terms of which metric will always be the perfect solution. Various centrality measures have been developed to identify key nodes depending on how one may quantify importance. As a result, our final score consists of an average between four centralities in the hopes of capturing players that contribute in four different facets of importance.


1. Betweenness Centrality (Importance through Flow)
Betweenness is calculated by going over how often a player lies on the shortest path between nodes. Players ranking highly here are crucial facilitators who maximize their team’s passing routes toward shots. When Tomas Hertl was on the Sharks last year, he often acted as the main link between any two teammates, resulting in their offensive movement flowing through him.

2. PageRank Centrality (Importance through Influence)
We can estimate a player’s influence by taking its PageRank score: an iterative process that takes into account the entire team dynamics. This one benefits skaters that connect highly-valued players to one another, essentially acting as intermediaries between central portions of the network. A good model of this is Gustav Forsling who is regularly involved in important playmaking sequences with other influential Panthers.

3. Information Centrality (Importance through Efficiency)
By considering all possible paths within a network, information centrality finds skaters who enhance the efficiency of the offensive system. For example, Vladislav Namestnikov consistently lines up in Winnipeg’s top 6 as a tertiary piece. He makes himself valuable by creating pathways that allow for flexible progression even if they are not the most direct options, rendering possessions more robust to interruptions should they arise.

4. Weighted Degree Centrality (Importance through Volume)
Keeping the simplest for last, weighted degree centrality favours heavily involved players as it simply sums the total edge weights coming in and out of a node. High-volume passers are boosted here even if their passes do not result in groundbreaking connections. Colton Parayko is rightfully not seen as some next-level playmaker, but he is still a frequent passer and key cog on the Blues’ back end.

This data is aggregated over every game, regressed for smaller sample players, and put on a similar scale (centred over the replacement level, and scaled by standard deviation). Averaging out the 4 model outputs for each player gives us our final metric, quantifying “Importance to Teammate Offence”.
By putting all these together, we obtain a score that rewards key play connectors, influential passers, players who extend the flexibility of the team’s offence, and highly involved skaters. This results in your expected top-end offensive contributors landing at the front of the pack. McDavid, Kucherov, MacKinnon, Draisaitl, and Quinn Hughes performed excellently in all four metrics, finishing in the top 10 overall as expected.

Although there is overlap between the four centrality measures, that is not necessarily a problem and each part contributes an important piece of the puzzle. More importantly, by themselves, centrality measures can be fairly volatile. But by combining them, this tendency is lessened, giving us a more stable and diverse metric. It also builds what is essentially an Offensive Puck-Movement Profile that outlines any given player’s inclinations with the puck and role when on the attack.
You can use the dashboard to check other player data from the 2020-21 season onwards here. As you can see above, the dashboard has been updated since this article’s initial release in Summer 2024 to bring its dimensions in line with the website’s other tools. It now shows each component’s progression over the years, along with the amount of tracked games for the selected player-season.
Chemistry Interactions
Using these profiles, we can also do a quick case study of how the different facets of puck-moving interact with each other to establish chemistry at the line level. We’ll be taking the Ottawa Senators’ first line as our example here. All the ranks mentioned in this section are league-wide amongst forwards during the 2023-24 season.
First, Brady Tkachuk is THE identity piece in Ottawa. He plays a very high-danger-centric style of game and so much of the Senators’ offence is geared towards getting him a chance in-tight whether that is through a screened tip, rebound, bumper play, or general net scramble. As a result, Brady has a lot of sway over how the team’s plays unfold, giving him a top 3 Influence (PageRank) score.
Next, at centre is Tim Stützle, who is the primary carrier and dynamic puck-mover. So many of the Senators’ possessions are made possible by virtue of Stützle connecting plays thanks to his playmaking and skating abilities. With such a high volume of Ottawa’s offensive pathways going through him, Timmy garners a top 3 Flow (Betweenness) score.

And lastly, on the right side we have Claude Giroux. As we hinted in the Information Centrality section, he tends to play more of a tertiary role on this line, acting as the reliable veteran piece for his two young linemates. But Claude goes beyond that, as his hockey IQ and anticipation of various potential passing routes allow him to ensure Ottawa’s offensive zone possessions can progress towards a chance no matter their current state. The adaptability and support he provides places him in the top 10 for the Efficiency (Information) metric.
Evidently, all three are exceptionally talented in all four of the measured skills. But the way in which each of them specialize in a different facet of play-driving (Tkachuk for influence, Stützle for flow, Giroux for efficiency), and how all these puck-movement abilities mesh together allows the line to consistently produce at a high level.
Peering into the Future
Although I’m very happy with where the final model stands currently, there are definite improvements that could be implemented down the road. First, we could attempt to instill some enhancements on the data quality side.
Now that we have a linked shot database that combines all these features of both MoneyPuck and AllThreeZones, we could develop a more advanced expected goals model. This approach could yield a better final product thanks to A3Z’s manually-tracked parameters providing greater context to shot attempts. It would feed directly into the network analysis by assigning more appropriate weights to the edges throughout the system.
The final calculation itself could also be improved. Instead of a simple average where each of the four centrality measures is treated equally, a weighted average might be better. I tested to see how the overall rankings would shift if the highest and lowest scores for each player were weighted down (to half-weight in this case). This was done in hopes of minimizing the effect of higher variability and rewarding players who performed more consistently across all metrics. However, I preferred the normal average’s results in comparison. Giving different weights to each of the four centralities (ex: flow-0.3, influence-0.4, efficiency-0.2, volume-0.1) is another avenue down which I have yet to travel.

We have mentioned data quality, but data quantity is likely the area which could benefit most from a boost. There is only so much manual tracking one can do over a season, and while a 400-plus game sample is incredibly useful and impressive, that still omits 800-900 regular season games from the analysis. Unfortunately for us in the public sphere, there is no easy solution to craft on our end. But developments from the NHL themselves that have been in the works for a while could provide an answer through NHL Edge. It is very much in its infancy, but the possibilities in player and puck tracking thanks to infrared cameras at NHL rinks may lead to enriched data in the future.
There is always room to grow and improve with projects like these, especially in the world of hockey analytics where our target is inherently chaotic. All we can hope to do is attempt to harness that chaos and continuously refine it so that it offers a useful look into the evaluation of this sport.