It’s been a busy summer here at LB-Hockey, from overhauls in the coding pipeline to new dashboards, redesigned statistical models, and many more changes. With that, it felt appropriate to bring back the Patch Notes series to delve into the new and improved.
New SPAR Model
I’m hoping to turn this new iteration of the SPAR model into its own article soon as this is the most impactful development from the summer. Standings Points Above Replacement, or SPAR for short, looks to estimate how many points in the standings a player contributed to their team relative to a replacement-level player. Previously, our SPAR model was built by combining all the tracked skills from our Player Cards, using weights based on intuition and testing results. That sum was then fed into an exponential curve based on sensical scaling of SPAR values in the hockey analytics space.
The problem with this started to be made apparent thanks to our Roster Builder and our standings projections method, where a replacement-level team was being calculated to be in the 30s (well below what had been researched and landed upon by other analysts). The exponential curve also resulted in very highly increasing SPAR outputs for the franchise players of the league. And lastly, while the rankings of players were fairly logical, some player archetypes were being undervalued, such as pure snipers and defensively inclined defencemen.
Obviously, the latter is nearly impossible to get completely right, but improvements seemed achievable. This was done by changing the skill weights to be based on their correlation with team success to capture impact, year-over-year repeatability for luck/randomness, and multi-collinearity with the rest of the measured toolkit for redundancies/overlap. Once the weighted average is calculated, we fit a model using team and player level data since 2021, which converts it into points probability added in a given game from a team having these skills added to its roster. Worth noting that this conversion is fit separately for forwards and defencemen now. Then, it’s just a matter of scaling up to a full 82-game (for now) season to obtain SPAR.

The goalie side follows a similar method too, but remains much simpler than skaters. We take their goals saved above expected (GSAx) per expected goal faced, and scale it by the average workload faced in a game from that season. From there, it’s the same procedure we apply to skaters (transforming into PTS% added, then SPAR).
Thanks to all these changes and an improved measurement of our chemistry SPAR estimation (more on that in a future article too), we now get more reasonably-scaled team SPAR values in both our Roster Builder and standings projections.
Categorical SPAR
With the above changes, we now have the ability to isolate how much SPAR a skater is contributing via each of our measured categories. By selecting the “SPAR” option rather than “SPAR%” in the drop-down above their overall pie chart, you can view their Zone Offence, Zone Defence, Transition, Checking, Teamplay, and Total SPAR.

It’s important to keep in mind that when viewing these, each category is weighted differently, and those weights change by position. For example, despite ranking in the 100th percentile for Zone Defence and 85th for Zone Offence, Sam Reinhart gets a bigger SPAR contribution from his ZO score since defensive zone play was shown to be less important when fitting the model on the forward side.
Goalie Steals & Chokes
At this rate, these patch notes are essentially just turning into a sneak peek for our future articles, and that doesn’t change here. Although the goalie cards don’t get the benefit of this new categorical SPAR breakdown, they’ve received their own re-organization of the centre metrics. Now, you can view how many stolen and choked games a goalie is responsible for. These are instances where a team either wins with the winning goalie posting a GSAx higher than their win differential, or loses with a GSAx lower than their loss differential (all excluding empty netters).

In the single-season cards, this will show a goalie’s steals and chokes from the selected season. Whereas in the multi-year ones, it is the totals from the last 3 years that are shown (as can be seen above with Gustavsson having 21 steals since the start of 2022-23). In addition, the Ideal Systems model to fit goalie styles with teams’ defensive tendencies has been reworked. Previously, it was a little too noisy and tried to account for too many variables, so it should be more focused now. For instance with Gus, Minnesota ranks 1st for his ideal team defences to play behind, while Ottawa is towards the bottom, shedding a little bit of light on his breakout following the trade in the last few years.
New Player Evaluation Metrics
Another fairly big change to the core of our player evaluation is that we’ve rotated in some new metrics to the cards. Aside from some slight renaming, these are confined within the Transition and Checking category. For the latter, the result is an expansion of forechecking detail. Previously, “Forechecking” was lumped into one stat. Whereas now, the ability to pressure the opposition into mistakes on breakout attempts (Forecheck Pressure) is isolated from winning battles deep in the zone to recover dump-ins (Forecheck Battling).


On the transition side, we have combined carried and passed entries into the Entry Volume score, making room for a new inclusion: Entry Efficiency. This measures the proportion of a player’s zone entry attempts that are successful with possession. Aside from some slight changes to how they are measured for forwards, Entry Disruption and Entry Chance Defence are simply renamed to mirror the structure of all transition metrics.
TheStanleyCap: Our New Contract Data Provider
This is the one that allowed for the most improvements in LB-Hockey’s coding pipeline. Earlier this year, David Johnson launched TheStanleyCap, a website covering NHL player contracts, team salary cap info, and more. It offers a clean look at contract data across the league in a post-CapFriendly environment. David has been a pleasure to deal with and he continues to add features over at TheStanleyCap, recently including subscription plans which I’d recommend looking into to support the site!

Best of all on the coding side, TSC uses the NHL-given playerIDs as keys for players. That allowed us to move forward with a completely playerID-driven data wrangling process, which was simply not possible previously due to the available data sources. This also required an overhaul regarding the ingestion of AllThreeZones data, but this process is now much better using team rosters by game pulled from the NHL API and with their team+jersey number as a key.
As a result, 2020-21 season data is included in more tools (such as the Offensive Puck-Movement Profile, Team Blueprints, & Matchup Engine) and brings all the metric calculations in line with following seasons, given it was previously in a somewhat restricted state due to data formatting issues that are now resolved.


There have been even more improvements completed during this summer code cleaning such as a big refactoring of our single-season scripts, reorganizing various peripheral functions, automating NHL Edge data collection, and adding defenceman handedness to our position data (which was highly requested).
A Better User Experience
We’ve fixed some of the less-than-fun quirks with Google Sheets for our subscribers. First, all dashboards have now been re-scaled for viewing at the 100% zoom default. Previously, having to zoom out (or in) would result in different scaling based on the user’s machine. So while a dashboard might look good when zoomed on a Mac, it wouldn’t on Windows (or vice-versa). Thankfully, that inconsistency is no longer present with this change.
Another qualm some people have had is the number of steps needed to use one of the tools, as making a copy of it is necessary, but that wasn’t immediately obvious and often forgotten by some.
To mend this, we’ve edited all the access buttons across the site such that they now link to an auto-copy prompt. Combined with the last change, this drastically shortens the steps needed to start using all of our tools, as the only thing necessary now is to press “Access” then “Make a copy”.

↓

It’s also worth mentioning that we’ve started making progress towards developing a proper web app for the site! The timeline to completion is still difficult to grasp given we are very much in the early stages, but this would be a solution that ditches Google Sheets entirely and drastically improves the UX. So far, we have just done some planning and finished work on parts of the backend, thanks to some help on the software side. Despite it still being a ways away, I’m very excited at the possibilities with this and will keep you all updated.
Tons of Content
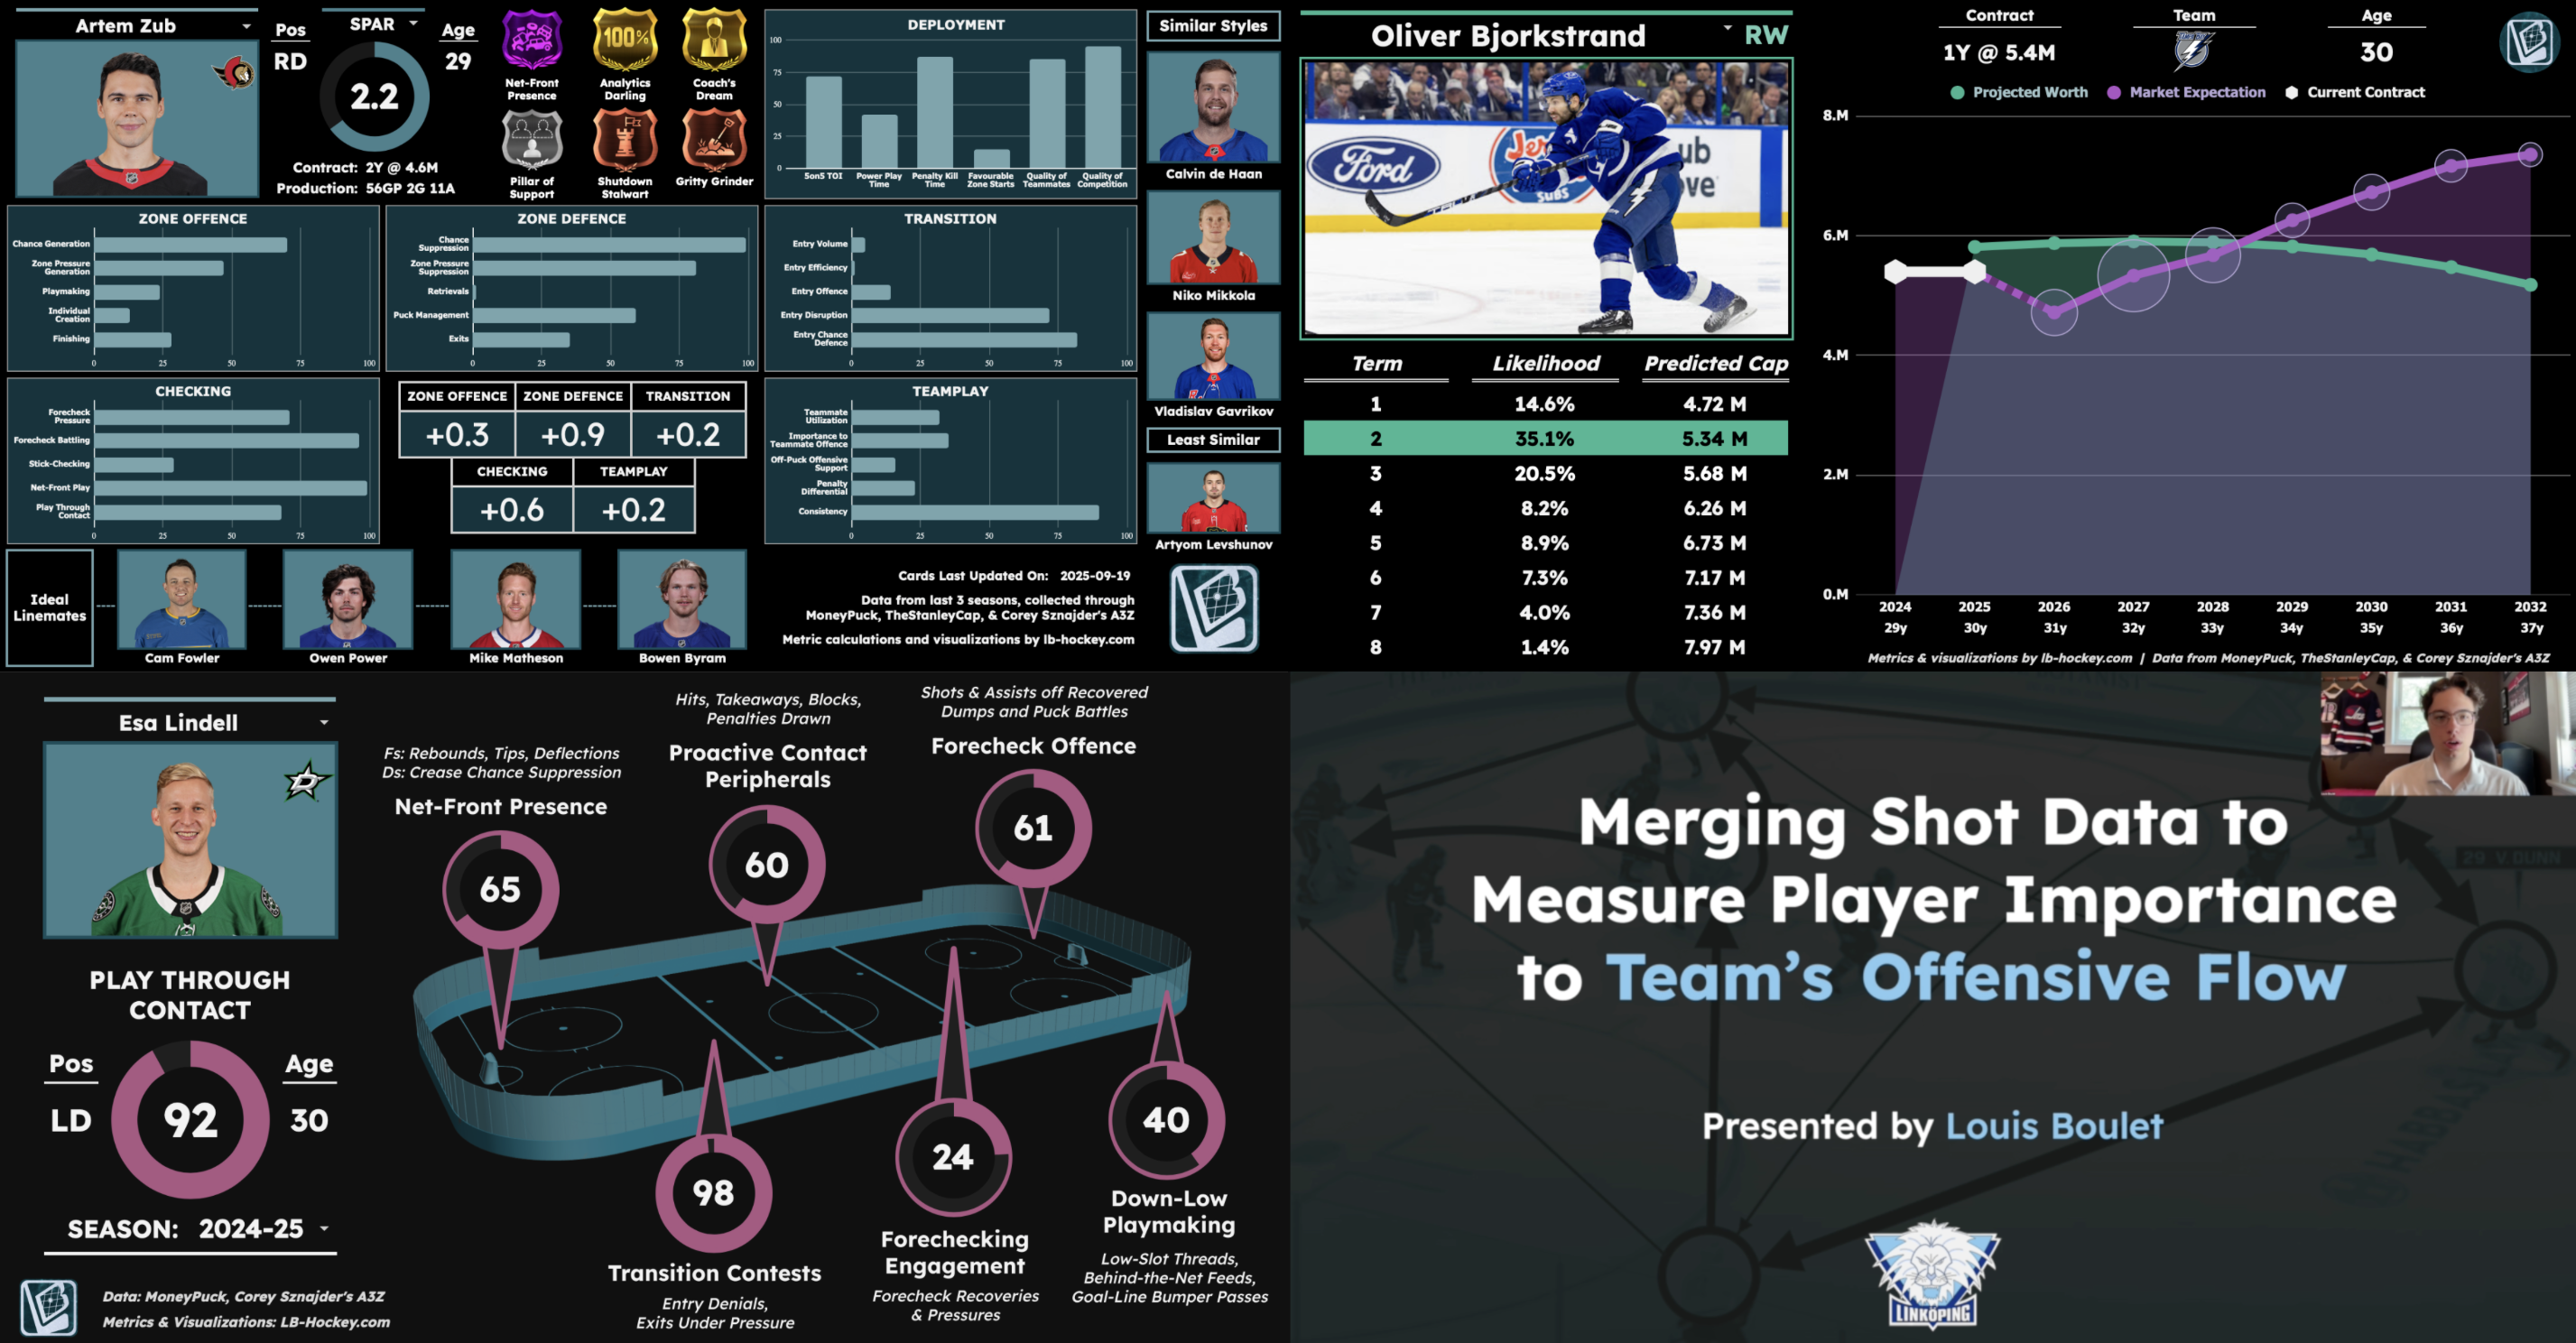
Despite all of these technical changes, that didn’t stop us from pumping out a bunch of new stuff throughout the summer. First, I had the honour of presenting our flagship article from last year, Merging Shot and Measuring Player Importance to Teams’ Offensive Flow, at the Linköping Hockey Analytics Conference. LINHAC unveiled a new Community Notes section for 2025, which highlighted innovative ideas across the hockey analytics sphere.
There, I walked through our process in linking shot data between MoneyPuck & AllThreeZones, how network analysis can be used to evaluate passing sequences, and a case study into how these skills interact to form chemistry.
Roughly one month later, we launched our first foray into salary analysis: the Contract Projector. With this, you can either view the likely term and cap dollars for the next contract of a player on an expiring deal, analyze the surplus values over their current deal or a custom extension.
This tool marked the end of phase 1 for LB-Hockey, signifying that the original vision I had for the site has been completed. But this doesn’t mean we’re anywhere close to being out of ideas for the future, as indicated by the roadmap we released this summer.

And lastly, we kicked off phase 2 with a bang. Don’t worry, the big chemistry article is coming sometime this season, but we moved it from our summer timeline in favour of a deep-dive into one of the most contentious areas of a player’s skillset: physicality.
Defining Physicality and Skaters’ Ability To Play Through It was potentially our most fast-tracked article, turning from idea to published article & accompanying dashboard in just under a week. And it’s a good thing we prioritized it because you all seemed to love it, shattering our views and visitors records two days in a row!
Through this article, we delved into what it means for a player to be physical and identified the “high-contact areas” of the ice to create our newest visualization: the Battle Grid. This allowed us to quantify a skater’s ability to play through contact. We then used all of this to evaluate its impact on team success with Florida’s potentially dynastic ways, and on player development with Sharks rookie Will Smith’s first season at the NHL level.
Overall, we got to complete 50+ issues in the LB-Hockey GitHub throughout the summer, and pushed out some work we are really proud of here. So thank you so much to all of you who continue to follow and support the site. As a reminder, you can subscribe here for just $6.99, which gives you access to the entire LB-Hockey arsenal of analytics tools and allows us to continue pushing this level of progress moving forward. See you all in the 2025-26 NHL season!