
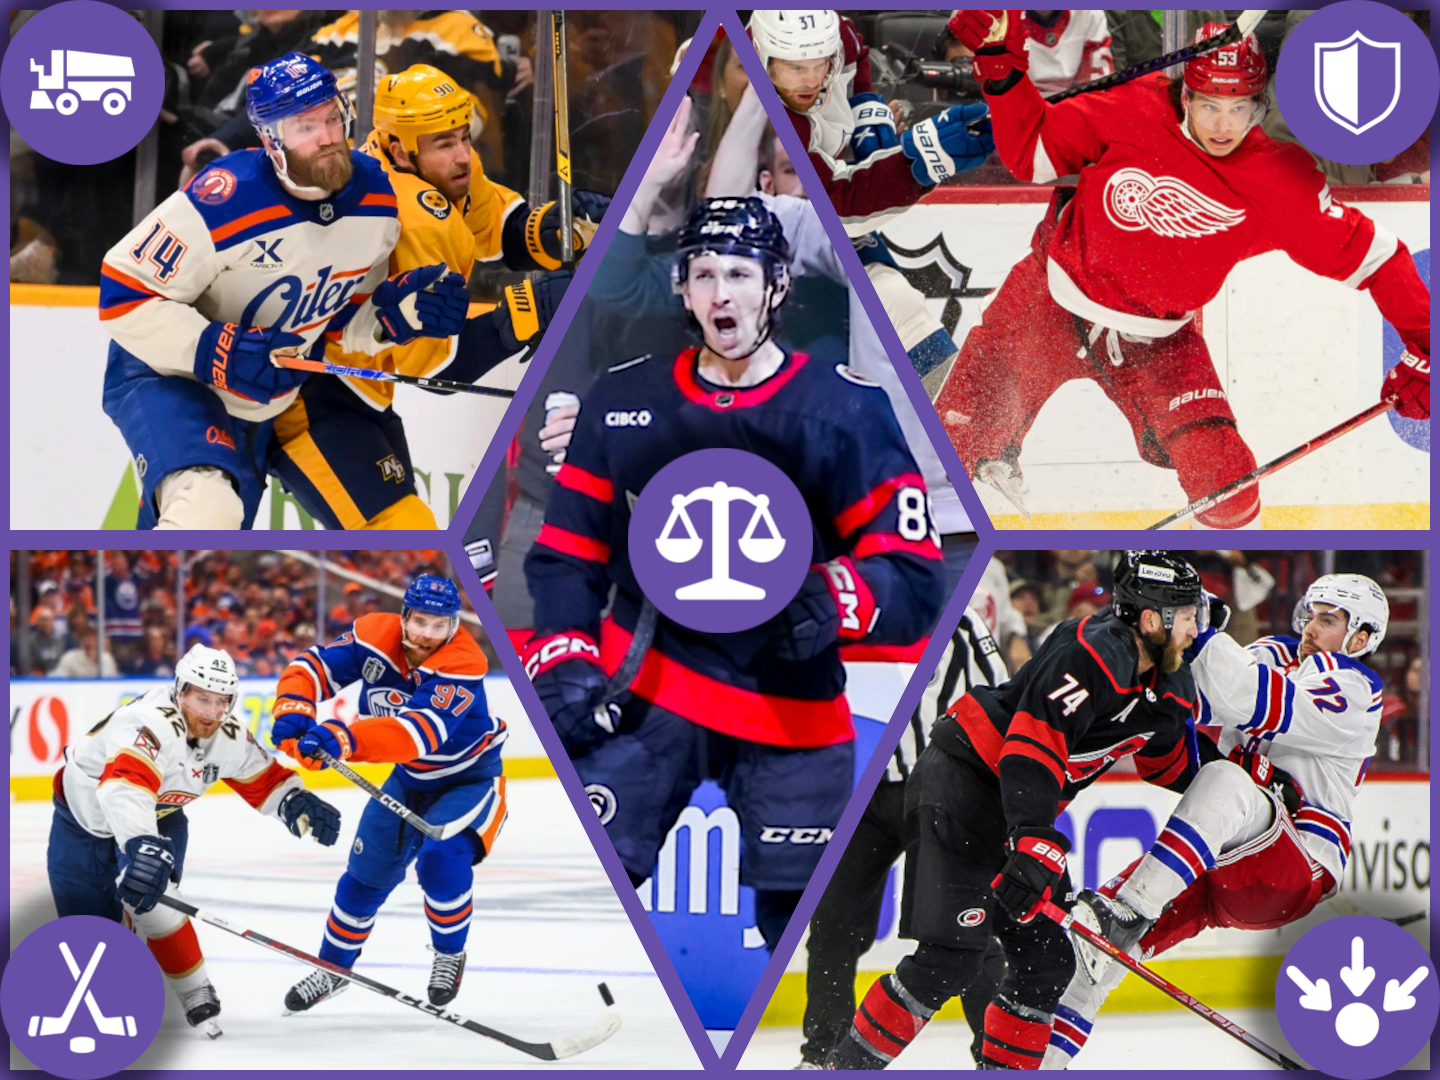

Your team is barely clinging to a one-goal lead late in the third period. The puck is frozen and you’ve got a defensive zone draw with 45 seconds remaining. Who do you send out to kill this crucial final shift? Do you pick the consistent chance suppressor? The stout net-front defender? The more active stick-checking pursuer? How should we weight these various shutdown skills to capture a player’s overall defensive ability? We will dive into this, how it has shaped the top pairs of recent Cup champs, and the track record of deserving vs actual Selke Trophy winners over the last few years.
The Current Ecosystem
As much as we’d love to tackle this study with the direct question, “What makes a player defensively adept?”, it also needs to be done in tandem with how much we can actually gather from publicly available data. It’s a tightrope we constantly need to walk during these exercises of pushing for innovation in this space.
There are already a few approaches that aim to estimate a player’s defensive impact. The most prominent examples are found at HockeyStats, EvolvingHockey, and HockeyViz, where their models are geared to isolate player impact via expected goal calculations. These include a primary defensive component, often titled even-strength defence (or abbreviated as EVD), and a secondary one while shorthanded. This is computed by measuring individual influences on expected goals against while accounting for various shift deployment variables.


Cards for HockeyStats, EvolvingHockey, and HockeyViz’s models respectively
These models perform admirably as final products, so why stray away from them? In short, I want to flesh out all the separate skills that make up a player’s defensive identity. So while EVD answers the “What” quite well, the goal here is to expand on the “How”. Which parts of a player’s toolkit allow them to shut down their opposition, and which ones are more important in achieving this?
Looping back to data availability, there are two main sources we can draw from here. First is the NHL API which, although lacks official documentation from the league, does still have a comprehensive guide thanks to GitHub user Zmalski: https://github.com/Zmalski/NHL-API-Reference. This holds all the primary statistics and peripherals you find in NHL stat pages and fan discussions such as goals, shots, assists, hits, blocks, penalties, etc. And that is the avenue taken by the large majority of hockey data projects including those listed above.
Through our work over the years here at LB-Hockey, we’ve been able to merge this data with detailed microstats thanks to Corey Sznajder’s AllThreeZones Project (AllThreeZones.com). This is an incredible endeavour to measure plays with greater depth such as forechecking events, carries or passes in transition, and even passes on every shot attempt rather than only on goals. Corey puts in tremendous work to produce this sample of tracked games every season, and I highly recommend supporting his work as it enables an entirely new tier of analysis to the public hockey analytics community. It’s this data that will enable us to expand our approach in determining the specific tools driving defensive results.
Identifying Defensive Skills
We can now move on to outlining events that correspond to shutdown tools within this available data pool. A total of ten skills have been isolated which can be separated into five pairs.
1. In-Zone Suppression
Chance Suppression & Mitigated D-Zone Pressure
Starting with the most commonly utilized form of defensive analytics is a player’s suppression in their own zone. We calculate both from the perspective of minimizing chances and pressure, with the latter being approximated through a blend of shot attempt volume and zone time. This captures skaters who have a strong understanding over rotations of play on the cycle, and can combine that with positional awareness plus situational pressure application to limit opportunities from the opposing team.
2. Collapsing Defence
Penalty Killing & Net-Front Play
This second category has a similar feel to the previous, but with a more confined focus. Here, we look at two situations where a player is forced to play within a tighter, more collapsing defensive structure: around the crease and when shorthanded. These conditions demand an enhanced ability from defenders to prevent scrambles and box out closer around the low-through-high slot. Forwards are omitted from the Net-Front Play stat, while skaters who don’t regularly skate on their team’s PK get null Penalty Killing scores.
3. Transition Defending
Entry Disruption & Entry Chance Defence

Shifting to more noticeable isolated defensive strengths, we have transition defending. This section in particular fully takes advantage of the aforementioned AllThreeZones data, with which we can measure players who successfully defend the rush aggressively and/or passively. An effective aggressive defender will frequently be capable of denying the zone when targeted on entry attempts. Meanwhile, a more passive one may not stop puck-carriers outright at the blue line, but will still stifle their opposition’s hopes of getting scoring chances off entries.
4. Puck Turnover
D-Zone Puck Management & Stick-Checking
Next, we look at how often players are directly involved in the flow of possession. Off the puck, this takes the form of turnover-causing stick-checks to cease the progress of opposing carriers. Whereas with it, we quantify the propensity to commit dangerous giveaways in their own zone, relative to their volume of D-zone puck touches of course.
5. Composure
Penalty Discipline & Game-to-Game Consistency
While executing all these shutdown tasks, it is also important not to hinder your own team in the process. The final skill section is directed toward capturing this exact point: providing reliable performances day in and day out. Wielding your body and stick as a defensive weapon without taking penalties is an especially crucial aspect of the sport. So is playing at the level your team expects repeatedly from game to game. This consistency metric was the subject of a previous Blueprints article of ours, which you can read below if curious.
Extra: Deployment Context
D-Zone Start Rate, Shorthanded Minutes
Quality of Teammates’ Defence, Quality of Competition’s Offence
These indicators are here with the goal of denoting player usage, which does give us a window into how they are perceived by their respective coaching staffs. This can be through often being deployed for draws in their own zone, acting as the mainstay for a PK unit, or matching up against the opposition’s most dangerous offensive pieces. It should be noted that these do still influence our final “one-number metric”, since they are accounted for as variables for the above statistics (especially on the suppression front) in the form of difficulty modifiers.
A Dossier of Defensive Dimensions
The obvious next question is how do we distill all of these data points into a singular output? Winning games is the ultimate goal in this league, so we will set that as our target in determining the impact of each particular skill. Their multicollinearity with the other tools and repeatability year-over-year are also taken into account to calculate weights. This is the exact approach we used in our SPAR Model Breakdown article.
While the full methodology is explained throughout that piece, here is how we derived the impact weights in short:
We take all team seasons from 2021-22 to 2024-25 and isolate their actual SPAR from forwards and defencemen (total team standings points minus replacement-level team threshold and goalie SPAR). We also sum their roster-wide score for each skill and position weighted by ice time, which tells us how much of a specific skill each team averaged on the ice at any given time. Now, we can simply conduct a linear regression to correlate each team’s weighted average forward and defenceman talent in a specific area against the team’s actual output attributed to skaters.
Capturing Playing Styles & Contributions, December 2025
The calculations for the repeatability and multicollinearity factors are much simpler, as we just average the correlation from year 1 to year 2 in every player’s skills for the former, and employ a VIF (Variance Inflation Factor) method for the latter. All that’s left is to combine these weights and apply them to our ten metrics to get our one-number evaluation of a player’s shutdown ability, which essentially acts as the defensive-only portion of their SPAR contributions (Standings Points Above Replacement).
Next comes the easy part: bringing it all together in one visualization!

Welcome the Defensive Dimensions Dossier (now accessible to LB-Hockey subscribers here), which illustrates all ten performance statistics grouped within their categories, the deployment context surrounding them, and one-number approximation of their defensive impact. All of these are displayed in percentiles relative to the position group (F or D) and selected season. Speaking of which, player seasons are available dating back to 2020-21 in addition to the “Multi-Year” option which acts as a current snapshot estimation using a 4-2-1 weighted average of the three most recent seasons.
As for how this can enhance our hockey analysis, we’ll dive into two sections here with one pertaining to forwards and the Selke Trophy, while the other concerns defencemen and their trend amongst Cup finalists in the 2020s.
Quantifying Recent Selke Winners
By building this rubric, we’ve developed a way to capture any player’s defensive value over a season, which essentially provides us with a data-driven methodology to award the Selke Trophy. And safe to say the results look really strong so far.
From every Selke race of the 2020s, the voted winner was also our leader half the time. Even more encouraging is how our leader in defensive SPAR finished top 2 in voting every season from 2021 to 2025. Patrice Bergeron and Aleksander Barkov dominated this scene throughout the first half of the 2020s, and it shows here thanks to their elite suppression numbers in tough minutes, efficient penalty killing, and disruptive sticks while remaining disciplined in the process.

Nico Hischier is the only one to break through their reign, posting in 2022-23 what currently stands as the highest defensive SPAR season amongst forwards, which earned him a 2nd-place Selke finish by PHWA voting.
Things seemed to shake loose this year however, as neither Bergeron nor Barkov were in the race which really opened up the pool of challengers. Not only did this result in a new D-SPAR leader and Selke winner, but it also brought about the widest mismatch between those two out of all seasons in our dataset. A lot of it can be attributed to Nick Suzuki’s two-way game being rewarded in one of the league’s biggest markets. He still scores very well exclusively defensively for us (93rd percentile as indicated above), but him hitting the 100-point mark on a franchise surrounded with plenty of deserved optimism and attention lately definitely helped his case towards the voters.
This year’s discrepancy also brings up a trend that requires attention: wingers getting snubbed in Selke conversations. Faceoffs are undoubtedly playing a big role in this difference of value perception, but in reality these are events where the impact is felt much more at a micro-level for individual plays rather than on a greater season-long scale where percentages remain very close to 50%.
Jiri Lehtinen stands as the only winger to have won the trophy since 1991, doing so three times in that span and most recently all the way back in 2003. And while the concentration of the league’s defensively elite forwards remains mostly down the middle, there are some on the wings who have been overlooked. Investigating voting trends in the past 5 years, there have only been four top-6 placements from wingers, all belonging to Mitch Marner (4th-2026, 3rd-2023) and Sam Reinhart (2nd-2025, 4th-2024).


Meanwhile, the data outlines further worthy wingers who deserved to be highlighted as contenders in that period. Brandon Hagel’s entire game has seen massive development in the last half-decade, turning into an elite disruptor. Seth Jarvis will continue to be an integral piece throughout Carolina’s contention cycle thanks to his relentless play. Jason Robertson’s smarts have helped him impede Dallas’s opposition throughout the seasons. On the recent side, Michael Amadio’s savvy stick-work and difficult workload elevated him as one of the league’s best shutdown pieces this year.
As for what this analysis can tell us about next year’s potential Selke winner, the large majority of forwards mentioned in this section have a good chance. Mikael Backlund stands out as a guy who likely deserved one at some point in his career (three top-10 finishes in our data through the 2020s including 2nd place last season), but him being 37 and the current state of the Flames make a potential legacy award doubtful.
Newer arrivals that should push strong bids for contention in the coming years are Shane Pinto and Noah Cates. Pinto asserted himself as the main piece on Ottawa’s stellar shutdown trio with Claude Giroux and the aforementioned Amadio. Pinto’s two-way prowess is impressive, as his workload was some of the toughest league-wide. Even through that, he still provided consistent defensive performances and offensive depth for the Senators. Potential top-6 minutes starting in 2026-27 should increase his visibility and bump his Selke odds moving forward.

Noah Cates is even more defensively-oriented in his play style and value, which is noticeable from his badges and stylistic comparables above. His shutdown ability has been unbelievably consistent, especially for a non-first-liner, as he scored at the 96th percentile or higher in D-SPAR each of his four NHL seasons so far. Only Barkov finished ahead of him in our data for 2024-25 (and by just a hair). Cates is one of the league’s best cycle suppressors, a dedicated back-checker, and an extraordinary penalty killer. It’ll be very interesting to see Philly’s usage of the Minnesota-native, as they are flush with offensive talent on the wings and have some other good-but-not-elite options down the middle. Will they enable his production to continue climbing, thus increasing his reputation in the public eye? Because as recent trends have shown, he may need it to get more respect from voters in future Selke races.
How It Manifests in Recent Cup Finalists
What most intrigued me when building this framework was how it could help us assemble a Cup contender. So while we have now answered what makes a player defensively adept, we can now explore what the required skill threshold is in this area to achieve team success in the playoffs. Let’s run through the past five seasons of Cup Finalists to see what jumps out among them.
Starting with the recent winners in Carolina who absolutely smothered their opposition throughout the entire postseason, only dropping one game leading into the Finals. And even then, that single loss was after coming off the longest break (11 days) between rounds of any NHL team since 1919; meanwhile their opponents were much warmer with a two-day pause. Their back end was a massive reason behind their domination, with defensive impacts rarely matched before: three top-16 dmen on our D-SPAR leaderboard and the entire group placing at the 70th percentile or higher.

Leaderboard from last summer’s Blueprints paper on meaningful physicality
The Panthers have had a huge influence on the league with their near-dynastic success in the mid-20s. Though much of what other teams attempt to emulate is their physicality and forecheck offence (as we explored last summer with our Play Through Contact article), the defensive side is just as disruptive. Gustav Forsling has evolved from waiver pickup to one of the league’s best transition defenders. Aaron Ekblad complemented him very well on those runs thanks to his size and stick to drive defensive success. Tack on strong D-SPAR contributions from the depth of Mikkola, Jones, Balinskis, Schmidt, Gudas, Kulikov, and OEL over their 3-year stretch and it’s no surprise they did so well.
Florida’s most common Cup opponents in Edmonton are an interesting case. They still score well within this data, but the stability (or depth) isn’t as strong. Their numbers on this front improved from good to great during the 2025 run, but missing Ekholm for most of it did not help (though Kulak was still a solid replacement). This was Bouchard’s best defensive season even though he still had his detractors. Sure he didn’t play difficult minutes, was poor in front of his own net, and played too aggressively on the rush resulting in getting turned around somewhat frequently. But he was one of the league’s best at mitigating sustained D-zone pressure and wielded an active stick to force disruptions everywhere on the ice. All of this could explain why the Oilers were unable to finish the job against Florida either time.

Shea Theodore and Brayden McNabb have remained great-to-elite inhibitors over the last four seasons, with the pair’s defensive output not-so-coincidentally peaking in both seasons that Vegas reached the Stanley Cup Finals (winners in ’23 and finalists in ’26).
The prior year saw easily the best offensive top pair hoisting the cup with Toews-Makar in Colorado. But more impressive is how the data also labels them as the strongest defensively over this stretch out of all finalists within their seasons. Toews led all players in D-SPAR for 2021-22 and Makar was 7th, with Josh Manson showing out rather strongly too.
Victor Hedman was Tampa Bay’s stalwart at the time, and the data supported his reputation. Although he didn’t succeed in opposing the Avs, he did lead the Lightning to a Cup 12 months before. Tampa used more of a balanced approach with Hedman (94% average over those two seasons), Cernak (93%), McDonagh (85%), and Sergachev (80%) scattered throughout the D corps.


So as we can see, all of these Stanley Cup finalists boasted incredibly strong defenders on their blue line. And that is especially prominent when laying out the data in front of us. Although the quality among teams’ depth dmen seemed to vary, there is one clear trend: a top pair that can defend together at an elite level is likely REQUIRED to contend.

All of these pairs were instrumental in their teams’ deep run: Carolina suffocated opponents to an unforeseen level thanks to one of the strongest defensive cores in recent memory, led by Slavin-Chatfield at the top. The Panthers jumped from Cinderella-run finalists to dominant consecutive winners when Forsling took that next step. Vegas returned to the final dance when McNabb & Theodore bounced back to, and even surpassed, their peak form.
The data vehemently agrees with their dominant play, as 9 of the above 10 pairings posted a 55% or higher 5v5 expected goal share during these playoffs per our xG model. The exception being 2023 Forsling-Ekblad, as all of Florida’s most common D pairs were below 50%, yet they remained the team’s best pair by xGF% and D-SPAR.

Another interesting tendency is that the team with the better pair according to defensive SPAR won EVERY Cup Finals series (which remains true when looking at the data both in raw and percentile form). And this D-SPAR data is based on regular season play, not playoffs. So it could really help us in analyzing and projecting successful teams heading into the postseason or a Cup Finals matchup.
Having said that, who could be next to lift the Stanley Cup? Which teams fit the blueprint that previous winners have established? Here’s what seems to be the necessary qualifications. Four of the past 5 Cup winners boasted a 1D who scored at the 98th percentile in D-SPAR. Only the 2023 Knights won below this threshold (93rd percentile). Meanwhile their partners averaged at the 90th percentile, with the lowest being 2025 Ekblad at 71%. This means the usual Cup-winning pair averaged 94% between the two partners, and a minimum mean of 85%.
Let’s take a look at the current teams who match these criteria going into next season.

What we get are five teams who meet the averages set by previous champions and five more who don’t quite get there but at least surpass the minimums we’ve observed. The first five all made the playoffs last year and are expected to either return as a top-end contender (CAR, VGK, DAL) or have decent enough odds at making it back to the dance (OTT, PHI).
We’ve talked plenty about Carolina and Vegas, but Dallas profiles EXACTLY like the average Stanley Cup champ. Lindell-Heiskanen score at the precise average percentiles of former winners’ 2D and 1D respectively. The pair have posted remarkable suppression numbers through difficult workloads, remaining a composed anchor for the Stars during their contention window.


Sanderson-Zub is far and away the highest-ranking duo by D-SPAR, ranking first and fourth individually across the entire league right now. Sanderson has drastically improved year-over-year, optimizing his balance of passive and aggressive tendencies against the puck. Now arguably the most difficult defenceman to match up against in the world, his mastery of ranged coverage through exceptional skating and stick usage likens him to a hyper-mobile octopus of disruption. Artem Zub is more subdued both in reputation and play style, yet almost equally as effective at shutting down opponents. All of our defensive skills stand out as strengths for the Khabarovsk native, except for penalty discipline. These two were the primary reason why Ottawa was the top chance suppression (xGA) team in the league last year and qualified for the postseason despite various team shortcomings. If the Sens want to keep their contention window open, they’d better re-sign Zub before he hits market next summer.
Philadelphia is the biggest surprise in this top group, but Travis Sanheim and Cam York are no slouch. Sanheim is a particularly fascinating player and deserving of more praise league-wide. But both Flyers are phenomenal shutdown pieces against the rush, defend the slot with authority, and rarely turn it over in their own zone, resulting in minimal chances for their opposition. With the injection of Martone and the development of Michkov helping up front, York-Sanheim are the crucial backbone opening up the contention window in Philly. Question is, will Tocchet keep them together or split them up to balance out the corps?

The next group doesn’t score quite as strong but still surpasses the lowest-ranking Cup winners. The usual suspects in Florida and Colorado resurface along with a couple of interesting additions. Gavrikov-Fox is one of them thanks to Gavrikov’s league-leading D-SPAR 2024-25 season that led to his signing in Manhattan. Fox continues to thrive as a two-way threat without the fanfare he should command. Anderson-Doughty is a huge reason for LA’s continuing playoff hopes/appearances despite stagnation throughout the rest of the roster and an underwhelming outcome from what used to be one of the league’s best prospect pools.
Utah’s emergence here might be the one to look out for most. By bringing in Weegar at the deadline and pairing him with Sergachev, the Mammoth ticked this shutdown top-pair box. And though they don’t meet the highs of some, Utah’s depth should help them greatly here. Schmidt and Marino round out a top-4 where every piece is above the 90th percentile. Even with Schmidt being on the older side, Dmitri Simashev is poised to enter this group over the next couple of years as he’s coming off a fantastic first season in North America.

There were a few other pairings that just missed the cut whether due to the coaching staff employing a balanced approach with their top suppressors anchoring different pairs (Moser+D’Astous+McDonagh on TBL and Pesce+Siegenthaler on NJD), the duo not qualifying as their team’s top pair (Brodin-Spurgeon on MIN), or a future superstar simply needing a tiny bit more development before achieving that level (Schaefer alongside Pelech on NYI).
To summarize, trends within recent champions indicate that we should expect one of DAL-CAR-VGK-OTT-PHI to be the next likeliest Cup hoisters, with the odds of FLA-COL-UTA-NYR-LAK being lower but still meeting the minimum qualifications. You obviously need more outside of these criteria, and like in the world of data science, there’s no “one-size-fits-all” approach that will perfectly apply to every situation/team. But this seems to be an item to check off the list if you want your team to be a serious contender.
Future Opportunities of Analysis
Building this rubric for isolating the impact of various defensive skills opens up our possibilities of analysis within hockey. I’m excited to see how these trends with D-SPAR hold up regarding the Selke race and top pairs of Cup winners, and far more can be done now that we’ve created this methodology. By combining it with last year’s paper on physicality for example, what more can we expect from player performances in the playoffs given that Mitch Marner, Jordan Staal, and Logan Stankoven (3 of the top 4 in Conn Smythe voting this year) all scored very highly this regular season in both D-SPAR and Play Through Contact?


Would a team be better off balancing defensive depth throughout its lineup or with few elite shutdown pieces at the top? What would a defensively-oriented version of the Norris Trophy look like? Actually that one is fairly easy to answer so to send this article off, here would be the winners through the 2020s according to the data: Devon Toews (2020-21 & 2021-22), Jaccob Slavin (2022-23 & 2023-24), Vladislav Gavrikov (2024-25), and Jake Sanderson (2025-26). Gustav Forsling deserves an honourable mention as he came very close the last few seasons.
With that said, thank you for your interest in this extensive piece, I appreciate it very much. As a reminder, LB-Hockey subscribers can access the Defensive Dimensions Dossier here. You can not only support us and our hockey R&D articles here at LB-Hockey, but also get access to a wide array of hockey analytics tools in the process such as detailed player cards, progression trackers, post-game reports, contract projectors, roster builders, and much more for just $7.99 a month or $79.99 a year. Thanks again for reading and see you soon!